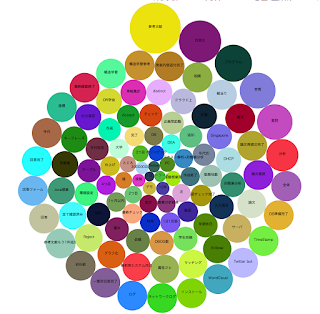
http://bl.ocks.org/mbostock/4063269
を見てやってみようと思ったのですが、データ階層が面倒だったので簡単な方法で
http://www.openspc2.org/reibun/D3.js/code/graph/bubble-chart/0003/index.html
がシンプルだったのでこれを使わせてもらいました。
1. jsファイルの作成
app]$ vi webroot/js/bubble.js
上記で使っているファイルに色をランダムにする部分を追加してあります。
This file contains bidirectional Unicode text that may be interpreted or compiled differently than what appears below. To review, open the file in an editor that reveals hidden Unicode characters.
Learn more about bidirectional Unicode characters
var svgWidth = 2080; // SVG領域の横幅 | |
var svgHeight =1080; // SVG領域の縦幅 | |
var diameter = 1080; // 一番大きい円のサイズ | |
var color = new Array(100); | |
color[0] = "none"; | |
for(var index = 1; index <= 100; index++){ | |
color[index] = rgbTo16("rgb("+Math.floor(Math.random()*256)+","+Math.floor(Math.random()*256)+","+Math.floor(Math.random()*256)+")"); | |
} | |
//var color = ["none", "#ff0000", "#", "orange", "#ffe090", "#a0ff90", "cyan", "#ccc", "#ff8080", "#c0ffc0", "#4090ff"]; | |
var svg = d3.select("#myGraph").append("svg") | |
.attr("width", svgWidth).attr("height", svgHeight) | |
var bubble = d3.layout.pack() | |
.size([diameter, diameter]) // 表示サイズを指定 | |
var grp = svg.selectAll("g") // グループを対象にする | |
.data(bubble.nodes(classes(list))) // データを読み込む | |
.enter() | |
.append("g") | |
.attr("transform", function(d) { // 円のX,Y座標を設定 | |
return "translate(" + d.x + "," + d.y + ")"; | |
}) | |
grp.append("circle") // 円を生成する | |
.attr("r", function(d){ // 円を指定した半径にする | |
return d.r; | |
}) | |
.attr("fill", function(d,i){ // 塗りの色を指定 | |
return color[i]; | |
//return rgbTo16("rgb(Math.floor(Math.random()*256), 0, 255)"); | |
}) | |
grp.append("text") // 文字を生成する | |
.attr("font-size", "9pt") // 文字のサイズを指定する | |
.attr("fill", "black") // 文字の塗りの色を指定する | |
.style("text-anchor", "middle") // 円の座標の中央から表示するようにする | |
.text(function(d) { return d.className; } ) // データの中のclassNameが地区名なので、それを出力 | |
function classes(root) { | |
var classes = []; | |
function recurse(name, node) { | |
if (node.children) node.children.forEach(function(child) { recurse(node.name, child); }); | |
else classes.push({packageName: name, className: node.name, value: node.households}); | |
} | |
recurse(null, root); | |
return {children: classes}; | |
} | |
function rgbTo16(col){ //color配列を作成 | |
return "#" + col.match(/\d+/g).map(function(a){return ("0" + parseInt(a).toString(16)).slice(-2)}).join(""); | |
} |
2.viewへの取り込み
app]$ vi View/Keywords/graph.ctp
This file contains bidirectional Unicode text that may be interpreted or compiled differently than what appears below. To review, open the file in an editor that reveals hidden Unicode characters.
Learn more about bidirectional Unicode characters
<div id="myGraph"></div> | |
<script> | |
var list = { | |
"name": "Keyphrase", | |
"children": [ | |
{ | |
"name": "twitter", | |
"children": [ | |
<?php for($index = 0; $index < $count; $index++){ ?> | |
{ "name": "<?php echo $weight[$index][0];?>", "households": <?php echo $weight[$index][1];?> }, | |
<?php }?> | |
] | |
} | |
] | |
}; | |
</script> | |
<?php echo $this->Html->script('bubble.js');?> |
ここで使っている$countはコントローラで生成してあります。
if(count($weight) < 100 ) {
$count = count($weight);
}else{
$count = 100;
}
$this->set('count',$count);
100件未満だと表示されないようなので、その場合は配列数にしてあります。
これで表示するとこんな感じです。
16進数への変換は
http://d.hatena.ne.jp/DECKS/20100907/1283843862
を利用しています。
0 件のコメント:
コメントを投稿