Processing math: 100%

2024年1月31日水曜日

Bakery Sales Dataset : (2) 日毎の販売回数をポアソン分布に従うとして、パラメタの事後分布を推定

 今回は、日毎の販売回数がポアソン分布に従うとして事後分布を推定していきます。

(1) 共役自然分布を使ったポアソン分布の事後分布推定の概要

ポアソン分布の尤度関数は次のように与えられる:
p(X|λ)=ni=1eλλxixi!
ここで、X=(x1,,xn) は観測データである。

ガンマ事前分布は次のように与えられる:
p(λ|a,b)=baΓ(a)λa1ebλ

ベイズの定理により、
p(λ|X)=p(λ,X)p(X)=p(X|λ)p(λ|a,b)p(X)p(X|λ)p(λ|a,b)
=ni=1eλλxixi!baΓ(a)λa1ebλ
λ(ni=1xi+a1)e(n+b)λ

以上より、事後分布はガンマ分布となり、そのパラメータは次のようになる:
apost=ni=1xi+a
bpost=n+b

したがって、λ の事後分布は次のようになる:
p(λ|X)=bapostpostΓ(apost)λapost1ebpostλ

つまり、ポアソン分布のパラメタλの事前分布をガンマ分布とおくと、λの事後分布は同じくガンマ分布になる。

(2) 販売回数がポアソン分布に従うときのパラメタ推定
ここでは、1日ごとの販売回数を集計し、そのデータを用いてポアソン分布のパラメータのベイズ推定を行います。その後、事後分布を求めてみましょう。まずは、日付ごとの販売回数を集計します。
#日毎の販売回数の集計
# Convert the 'DateTime' column to datetime objects
bakery_data['DateTime'] = pd.to_datetime(bakery_data['DateTime'])
# Extract the date from the 'DateTime' column
bakery_data['Date'] = bakery_data['DateTime'].dt.date
# Group by the date and count the number of transactions per day
daily_sales = bakery_data.groupby('Date')['TransactionNo'].nunique()
# Display the first few rows of the daily sales
daily_sales
view raw gistfile1.txt hosted with ❤ by GitHub
ここでは、事前分布としてガンマ分布を使用し、事後分布を計算してみましょう。ガンマ分布は、形状パラメータ(α)と尺度パラメータ(β)を持ちます。これらのパラメータを適切に選ぶことが重要です。仮に、α=β=1(一様事前分布に近い)として計算してみます。
from scipy.stats import gamma, poisson
import numpy as np
# Define the prior parameters for the gamma distribution (alpha and beta)
alpha_prior = 1
beta_prior = 1
# Calculate the posterior parameters
# For gamma-poisson conjugate, the posterior alpha is prior alpha + sum of observed counts
# And posterior beta is prior beta + number of observations
alpha_posterior = alpha_prior + daily_sales.sum()
beta_posterior = beta_prior + len(daily_sales)
# Generate a range of lambda values for plotting the posterior
lambda_values = np.linspace(0, daily_sales.max(), 100)
# Calculate the posterior gamma distribution for these lambda values
posterior_distribution = gamma.pdf(lambda_values, a=alpha_posterior, scale=1/beta_posterior)
# Plot the posterior distribution
import matplotlib.pyplot as plt
plt.figure(figsize=(10, 6))
plt.plot(lambda_values, posterior_distribution, label="Posterior Distribution")
plt.title("Posterior Distribution of the Poisson Parameter (λ)")
plt.xlabel("λ (Average Number of Sales per Day)")
plt.ylabel("Probability Density")
plt.legend()
plt.grid(True)
plt.show()
view raw gistfile1.txt hosted with ❤ by GitHub
ポアソン分布のパラメータ(λ)の事後分布をプロットしました。このグラフは、観測データとガンマ分布を事前分布とした場合のλの事後確率密度を示しています。
この事後分布から、平均販売回数の最も確からしい値や、その不確実性を評価することができます。例えば、事後分布のピークはλの最も可能性の高い値を示し、分布の幅は不確実性の程度を示します。

(3) 得られたλの事後分布からのMAP(Maximum A Posteriori)推定
AP推定は事後分布を最大化するλの値を見つけることです。ガンマ分布の場合、a>1 のとき、λのMAP推定値は次のようになります: 
ˆλMAP=argmaxλ(p(X|λ)p(λ|a,b))
 
ˆλMAP=apost1bpost
 
ガンマ分布の最大値はそのモード(最頻値)となる性質があります。
実際求めてみます。
# Calculate the mode (MAP estimate) of the posterior gamma distribution
if alpha_posterior > 1:
lambda_map_estimate = (alpha_posterior - 1) / beta_posterior
else:
lambda_map_estimate = 0
lambda_map_estimate
view raw gistfile1.txt hosted with ❤ by GitHub
ポアソン分布のパラメータ(λ)の最大事後確率(MAP)推定値は約59.16です。これは、観測データをもとに、平均販売回数が一日あたり約59回であると推定されることを意味します。この値は、データと事前分布から導き出された最も確からしい販売回数の推定値です。

今度は、α=2,β=1でやって、先ほどの結果と比較してみます。新しい事前分布に基づいたλの最大事後確率(MAP)推定値は約59.16で同じでした。これは、事前分布を変更しても、観測データの影響が大きいため、MAP推定値に大きな変化が見られないことを示しています。この結果は、データが豊富であればあるほど、事前分布の影響が小さくなるというベイズ推定の特性を反映しています。

(4)事後予測分布

事後予測分布(Posterior Predictive Distribution)は、ベイズ統計学の枠組みで使用される重要な概念の1つで、ベイズ推論を行った結果から未知のデータポイントの分布を予測するための確率分布です。事後予測分布は以下のように表されます: 

P(Xnew|X)=P(Xnew|λ)P(λ|X)dλ


ここで、ポアソン分布のパラメータ λ がガンマ分布に従う場合、事後予測分布は負の二項分布(またはポリヤ分布)になります。 

負の二項分布の確率質量関数(PMF)は以下のように表されます: 

P(xnew|apost,bpost,X)=Γ(xnew+apost)xnew!Γ(apost)(bpostbpost+1)apost(1bpost+1)xnew

これをやろうとすると、先ほど求めたパラメタαpost=9466,β=160(α=2,β=1)となってしまい、累乗の計算が困難です。以下のように実施します。

from scipy.stats import nbinom
# 新しいデータ点 x_new が取り得る値の範囲
x_new_values = range(0, daily_sales.max())
# 事後予測分布を計算(負の二項分布を使用)
p_pred = [nbinom.pmf(k=x_new, n=alpha_posterior, p=beta_posterior/(1+beta_posterior)) for x_new in x_new_values]
# 結果をプロット
import matplotlib.pyplot as plt
plt.bar(x_new_values, p_pred, color='blue', alpha=0.7)
plt.title('Posterior Predictive Distribution')
plt.xlabel('x_new')
plt.ylabel('Probability')
plt.show()
view raw gistfile1.txt hosted with ❤ by GitHub

最後にMCMCで事後予測分布を可視化します。

import pymc as pm
import arviz as az
import numpy as np
import matplotlib.pyplot as plt
from scipy.stats import gamma
# 観測データ
x = daily_sales.values # 観測データの例
with pm.Model() as model:
mu = pm.Gamma('mu', alpha=2, beta=1) #事前分布
obs = pm.Poisson('obs', mu=mu, observed=x) #尤度
with model:
trace = pm.sample(3000, return_inferencedata=False) #定義されたモデルを使って、観測データxからサンプリングされるmuの値を3000個算出している
idata = pm.to_inference_data(trace) #複数のchainを並行してサンプリング
az.plot_trace(idata) #複数のchainでのmuの分布
print(az.summary(idata)) #統計値の確認
az.plot_posterior(idata) #muの変動の様子
with model: #事後予測分布(事後分布を使って実際のデータの予測)
ppc = pm.sample_posterior_predictive(idata, return_inferencedata=False) #このidataからサンプルされたパラメータ(この場合はmu)を使って、新しい観測データのサンプルを生成
idata_ppc = pm.to_inference_data(posterior_predictive=ppc)
# 記述統計量(平均・分散)によるチェック
ppc_samples = ppc['obs']
ppc_samples = ppc_samples.reshape(-1, 50)
ppc_mean = ppc_samples.mean(axis=1)
ppc_var = ppc_samples.var(axis=1)
print('PPC_Mean = {0}'.format(ppc_mean))
print('PPC_Var = {0}'.format(ppc_var))
# 分布によるチェック
az.plot_ppc(idata_ppc, kind='kde', num_pp_samples=50, figsize=(12, 4));
az.plot_ppc(idata_ppc, kind='kde', num_pp_samples=3000, figsize=(12, 4));
view raw gistfile1.txt hosted with ❤ by GitHub

ここまでのソースコード

2024年1月26日金曜日

糖尿病:Diabetes Health Indicators Dataset : 02 主成分分析からクラスタリングまで

 糖尿病:Diabetes Health Indicators Dataset : 基本分析01の続きを行なっていきます。今回は主成分分析と主成分分析の結果を用いたクラスタリングです。

1. 主成分分析の実施

まず主成分分析を行なっていきますが、今回のように要素が多い場合、主成分分析で次元削減を行い、新たな軸で分析することは有効です。今回は累積寄与率80%で分析を行います。主成分分析を行い、各主成分の項目ごとのウエイトをデータフレームにして算出します。今回は目的変数に相当する「Diabetes_binary」は除いた21項目で実施しました。80%の累積寄与率でやると14主成分となっています。

import numpy as np
from sklearn.preprocessing import StandardScaler
from sklearn.decomposition import PCA
# Excluding the target variable 'Diabetes_binary' for PCA
features = data.drop('Diabetes_binary', axis=1)
# Scaling the data
scaler = StandardScaler()
scaled_features = scaler.fit_transform(features)
# Performing PCA
pca = PCA()
principal_components = pca.fit_transform(scaled_features)
# Explained variance ratio for each principal component
explained_variance_ratio = pca.explained_variance_ratio_
# Calculating the cumulative variance
cumulative_variance = explained_variance_ratio.cumsum()
# Finding the number of components to reach 80% cumulative variance
n_components_80 = (cumulative_variance >= 0.80).argmax() + 1
# Performing PCA with the desired number of components
pca_80 = PCA(n_components=n_components_80)
principal_components_80 = pca_80.fit_transform(scaled_features)
# Creating a DataFrame for the principal components
principal_df_80 = pd.DataFrame(data=principal_components_80, columns=[f'PC{i}' for i in range(n_components_80)])
# Calculating loadings (correlation between original features and the selected principal components)
loadings_80 = pca_80.components_.T * np.sqrt(pca_80.explained_variance_)
# Creating a DataFrame for the loadings
loadings_df_80 = pd.DataFrame(data=loadings_80, columns=[f'PC{i}' for i in range(n_components_80)], index=features.columns)
# Transposing the loadings DataFrame to swap rows and columns
loadings_df_80_transposed = loadings_df_80.transpose()
# Display the transposed loadings DataFrame
loadings_df_80_transposed
view raw gistfile1.txt hosted with ❤ by GitHub

これだとはっきりしないので、ヒートマップで色分けしてみます。
import matplotlib.pyplot as plt
import seaborn as sns
# Creating a heatmap for the loadings
plt.figure(figsize=(14, 8))
sns.heatmap(loadings_df_80_transposed, cmap='coolwarm', annot=True)
plt.title('Heatmap of PCA Loadings')
plt.ylabel('Principal Components')
plt.xlabel('Features')
plt.show()
view raw gistfile1.txt hosted with ❤ by GitHub
演習:このヒートマップをみて、各主成分(PC0 ~ PC4)に名前をつけましょう。
  • PC0: この主成分は「GenHlth」(一般的な健康状態)や「PhysHlth」(身体的健康)などの特徴量に高い負荷量を持っています。したがって、この主成分は「全体的健康状態」を反映していると考えることができます。
  • PC1: 「Age」(年齢)に高い負荷量を持っており、「Education」(教育)や「Income」(収入)にも影響を与えています。この主成分は「年齢と社会経済的地位」を反映していると言えるでしょう。
  • PC2: 「Fruits」(果物の摂取)や「Veggies」(野菜の摂取)に高い負荷量を持っています。この主成分は「食生活の健康性」を表している可能性があります。
  • PC3: この主成分は「BMI」(体格指数)に高い負荷量を持っており、「CholCheck」(コレステロール検査)や「GenHlth」(一般的な健康状態)にも影響を与えています。この主成分は「身体的健康とライフスタイル」を反映していると考えられます。
  • PC4: 「Smoker」(喫煙)に高い負荷量を持っていることが見られます。また、他の健康関連の特徴量にも影響を与えています。この主成分は「喫煙と関連する健康リスク」を表している可能性があります。
累積寄与率のグラフを書いてみます。
# Creating a plot for the cumulative variance with a horizontal line at 80%
plt.figure(figsize=(10, 6))
plt.plot(cumulative_variance, marker='o')
# Adding annotations for each point
for i, v in enumerate(cumulative_variance):
plt.text(i, v + 0.01, f"{v:.2f}", ha='center', va='bottom', fontsize=8)
# Adding a horizontal line at 80% cumulative variance
plt.axhline(y=0.80, color='r', linestyle='--')
plt.title('Cumulative Variance Explained by Each Principal Component')
plt.xlabel('Number of Components')
plt.ylabel('Cumulative Explained Variance')
plt.grid(True)
plt.show()
view raw gistfile1.txt hosted with ❤ by GitHub
次に主成分0と1を使って、biplotで表示します。まずは「Diabetes_binary」が1のときです。
def biplot_diabetes_smaller_arrows(score, coeff, diabetes_data):
xs = score[:,0]
ys = score[:,1]
n = coeff.shape[0]
scalex = 1.0/(xs.max() - xs.min())
scaley = 1.0/(ys.max() - ys.min())
# Plotting points for diabetes cases only
diabetes_points = score[diabetes_data == 1]
plt.scatter(diabetes_points[:, 0] * scalex, diabetes_points[:, 1] * scaley, color='red', s=5, label='Diabetes')
# Using smaller arrows for better visibility
for i in range(n):
plt.arrow(0, 0, coeff[i,0], coeff[i,1], color='blue', alpha=0.7, linewidth=1.2, head_width=0.03)
plt.text(coeff[i,0]* 1.15, coeff[i,1] * 1.15, features.columns[i], color='green', ha='center', va='center')
plt.xlabel("PC{}".format(0))
plt.ylabel("PC{}".format(1))
plt.legend()
plt.grid()
# Calling the biplot function for diabetes cases only with smaller arrows
plt.figure(figsize=(12, 8))
biplot_diabetes_smaller_arrows(principal_components[:,0:2], np.transpose(pca.components_[0:2, :]), data['Diabetes_binary'])
plt.show()
view raw gistfile1.txt hosted with ❤ by GitHub
次に「Diabetes_binary」が0のときです。
def biplot_non_diabetes_only(score, coeff, diabetes_data):
xs = score[:,0]
ys = score[:,1]
n = coeff.shape[0]
scalex = 1.0/(xs.max() - xs.min())
scaley = 1.0/(ys.max() - ys.min())
# Plotting points for non-diabetes cases only
non_diabetes_points = score[diabetes_data == 0]
plt.scatter(non_diabetes_points[:, 0] * scalex, non_diabetes_points[:, 1] * scaley, color='blue', s=5, label='Non-Diabetes')
# Using smaller arrows for better visibility
for i in range(n):
plt.arrow(0, 0, coeff[i,0], coeff[i,1], color='red', alpha=0.7, linewidth=1.2, head_width=0.03)
plt.text(coeff[i,0]* 1.15, coeff[i,1] * 1.15, features.columns[i], color='green', ha='center', va='center')
plt.xlabel("PC{}".format(0))
plt.ylabel("PC{}".format(1))
plt.legend()
plt.grid()
# Calling the biplot function for non-diabetes cases only
plt.figure(figsize=(12, 8))
biplot_non_diabetes_only(principal_components[:,0:2], np.transpose(pca.components_[0:2, :]), data['Diabetes_binary'])
plt.show()
view raw gistfile1.txt hosted with ❤ by GitHub
PC2も加えて3次元で表示してみます。
from mpl_toolkits.mplot3d import Axes3D
def biplot_3d_with_arrows(score, coeff, diabetes_data, ax):
xs = score[:,0]
ys = score[:,1]
zs = score[:,2]
n = coeff.shape[0]
# Plotting points for diabetes and non-diabetes cases
ax.scatter(score[diabetes_data == 1, 0], score[diabetes_data == 1, 1], score[diabetes_data == 1, 2], color='red', s=5, label='Diabetes')
ax.scatter(score[diabetes_data == 0, 0], score[diabetes_data == 0, 1], score[diabetes_data == 0, 2], color='blue', s=5, label='Non-Diabetes')
# Plotting the feature vectors as arrows
for i in range(n):
ax.quiver(0, 0, 0, coeff[i,0], coeff[i,1], coeff[i,2], color='black', arrow_length_ratio=0.05)
ax.set_xlabel("PC0")
ax.set_ylabel("PC1")
ax.set_zlabel("PC2")
ax.legend()
# Correcting the error by using the correct variable for diabetes data
diabetes_data = data['Diabetes_binary']
# Re-creating two 3D plots for better visibility
fig = plt.figure(figsize=(16, 8))
# Plot for Diabetes cases
ax1 = fig.add_subplot(121, projection='3d')
biplot_3d_with_arrows(principal_components[diabetes_data == 1, 0:3], np.transpose(pca.components_[0:3, :]), diabetes_data[diabetes_data == 1], ax1)
ax1.set_title('Diabetes Cases')
# Plot for Non-Diabetes cases
ax2 = fig.add_subplot(122, projection='3d')
biplot_3d_with_arrows(principal_components[diabetes_data == 0, 0:3], np.transpose(pca.components_[0:3, :]), diabetes_data[diabetes_data == 0], ax2)
ax2.set_title('Non-Diabetes Cases')
plt.show()
view raw gistfile1.txt hosted with ❤ by GitHub

演習:biplotの結果からどのようなことが言えるでしょうか?

2. 主成分分析の結果からクラスタリング実施
次にクラスタリングを実施してみます。元データからではなく、主成分分析で求まる射影行列を使ってのクラスタリングを行います。今回はK-means法で5個のクラスタに分類してみます。
# Full Python code to perform clustering and calculate statistics
import pandas as pd
from sklearn.preprocessing import StandardScaler
from sklearn.decomposition import PCA
from sklearn.cluster import KMeans
import matplotlib.pyplot as plt
import seaborn as sns
# Assuming 'data' is the original DataFrame and 'features' are the feature columns
# Scaling the data
scaler = StandardScaler()
scaled_features = scaler.fit_transform(features)
# Performing PCA
pca = PCA()
principal_components = pca.fit_transform(scaled_features)
# Performing KMeans clustering with 5 clusters
kmeans = KMeans(n_clusters=5, random_state=0).fit(principal_components)
labels = kmeans.labels_
# Adding the cluster labels to the original DataFrame
data_with_clusters = data.copy()
data_with_clusters['Cluster'] = labels
# Calculating mean values of each feature for each cluster
cluster_means = data_with_clusters.groupby('Cluster').mean()
# Calculating the percentage of diabetes cases in each cluster
cluster_diabetes_percentage = data_with_clusters.groupby('Cluster')['Diabetes_binary'].mean() * 100
# Adding the diabetes rate to the cluster means DataFrame
cluster_means_with_diabetes_rate = cluster_means.copy()
cluster_means_with_diabetes_rate['Diabetes Rate'] = cluster_diabetes_percentage
# Renaming the index to 'Cluster' and resetting index
cluster_means_with_diabetes_rate.index.name = 'Cluster'
cluster_means_with_diabetes_rate.reset_index(inplace=True)
# The final DataFrame
cluster_means_with_diabetes_rate
view raw gistfile1.txt hosted with ❤ by GitHub
この結果をヒートマップで表示してみやすくしてみます。値を整えてから出力します。
from sklearn.preprocessing import MinMaxScaler
# Dropping the 'Cluster' column for scaling
cluster_data_for_scaling = cluster_means_with_diabetes_rate.drop('Cluster', axis=1)
# Applying Min-Max scaling
scaler = MinMaxScaler()
cluster_scaled = scaler.fit_transform(cluster_data_for_scaling)
# Creating a DataFrame from the scaled data
cluster_scaled_df = pd.DataFrame(cluster_scaled, columns=cluster_data_for_scaling.columns)
# Creating a heatmap of the scaled cluster means DataFrame
plt.figure(figsize=(15, 10))
sns.heatmap(cluster_scaled_df, annot=True, cmap='coolwarm', fmt=".2f")
plt.title('Heatmap of Scaled Cluster Means with Diabetes Rate')
plt.xlabel('Features')
plt.ylabel('Clusters')
plt.show()
view raw gistfile1.txt hosted with ❤ by GitHub
演習:それぞれのクラスタの特徴を書き出してみましょう。
  • クラスタ0 (「低リスク・健康志向」): このクラスタは全体的に低い糖尿病率と低い健康リスク指標(BMI、高血圧など)を示しており、身体活動が高いことが特徴です。

  • クラスタ1 (「中高年・リスクあり」): 高い年齢層に属し、高血圧や高コレステロールの割合が高い。中程度の糖尿病率を持つ。

  • クラスタ2 (「高リスク・健康課題」): 最も高い糖尿病率を持ち、BMIや心臓病のリスクも高い。身体活動が低く、健康上の課題が多い。

  • クラスタ3 (「アクセス限定・中リスク」): 一般的な健康状態は中程度で、医療へのアクセスが限られている(NoDocbcCostが高い)ことが特徴。中程度の糖尿病率。

  • クラスタ4 (「若年・喫煙者」): 比較的若い年齢層で喫煙率が高い。糖尿病の割合は比較的低いが、長期的な健康リスクを持つ可能性がある。


このような方法で、基本的な分析からクラスタリングをすることで、データの内容がわかりやすくなったと思います。

2024年1月22日月曜日

糖尿病:Diabetes Health Indicators Dataset : 基本分析01

糖尿病オープンデータを分析していきます。今回の分析は、Diabetes Health Indicators Dataset (https://www.kaggle.com/datasets/alexteboul/diabetes-health-indicators-dataset)を用いていきます。このデータには、22項目があり、
  • Diabetes_012:糖尿病の状態を示す変数です。

    • 0 = 糖尿病なし
    • 1 = 前糖尿病
    • 2 = 糖尿病
  • HighBP:高血圧の状態を示す変数です。

    • 0 = 高血圧なし
    • 1 = 高血圧
  • HighChol:高コレステロールの状態を示す変数です。

    • 0 = 高コレステロールなし
    • 1 = 高コレステロール
  • CholCheck:過去5年間にコレステロール検査を受けたかどうかを示す変数です。

    • 0 = 過去5年間にコレステロール検査なし
    • 1 = 過去5年間にコレステロール検査あり
  • BMI:身体質量指数

  • Smoker:過去に少なくとも100本のたばこを吸ったかどうかを示す変数です。

    • 0 = 吸ったことなし
    • 1 = 吸ったことあり
  • Stroke:脳卒中を経験したかどうかを示す変数です。

    • 0 = 脳卒中なし
    • 1 = 脳卒中あり
  • HeartDiseaseorAttack:冠動脈性心疾患(CHD)または心筋梗塞(MI)の有無を示す変数です。

    • 0 = なし
    • 1 = あり
  • PhysActivity:過去30日間に非職業的な身体活動を行ったかどうかを示す変数です。

    • 0 = していない
    • 1 = している
  • Fruits:果物を1日1回以上摂取するかどうかを示す変数です。

    • 0 = 摂取しない
    • 1 = 摂取する
  • Veggies:野菜を1日1回以上摂取するかどうかを示す変数です。

    • 0 = 摂取しない
    • 1 = 摂取する
  • HvyAlcoholConsump:週に14杯以上のアルコール飲料を摂取する男性または週に7杯以上のアルコール飲料を摂取する女性かどうかを示す変数です。

    • 0 = そうでない
    • 1 = そうである
  • AnyHealthcare:いかなる種類の健康保険または医療保険を持っているかどうかを示す変数です。

    • 0 = 持っていない
    • 1 = 持っている
  • NoDocbcCost:過去12か月間に医師を訪れる必要があったが、費用のために訪れることができなかったかどうかを示す変数です。

    • 0 = 訪れなかった
    • 1 = 訪れることができなかった
  • GenHlth:一般的な健康状態を示す変数です。スケール1-5

    • 1 = 優れている
    • 2 = とても良い
    • 3 = 良い
    • 4 = まあまあ
    • 5 = 悪い
  • MentHlth:精神的な健康状態を示す変数です。過去30日間の精神的な健康に関する日数を表します。スケール1-30

  • PhysHlth:身体的な健康状態を示す変数です。過去30日間の身体的な健康に関する日数を表します。スケール1-30

  • DiffWalk:歩行や階段の昇降に重大な困難があるかどうかを示す変数です。

    • 0 = なし
    • 1 = あり
  • Sex:性別

    • 0 = 女性
    • 1 = 男性
  • Age:年齢カテゴリー

    • 1 = 18-24歳
    • 9 = 60-64歳
    • 13 = 80歳以上
  • Education:教育レベル

    • スケール1-6
    • 1 = 学校に通ったことがないか、幼稚園のみ
    • 2 = 小学校(1年から8年)
    • 3 = 高校に通ったことがあるが、中途で中退(9年から11年)
    • 4 = 高校卒業(12年またはGED)
    • 5 = 大学1年から3年(一部大学または専門学校)
    • 6 = 大学4年以上(大学卒業)
  • Income:収入スケール

    • スケール1-8
    • 1 = 10,0005=35,000未満
    • 8 = $75,000以上
となっています。実際にダウンロードした「diabetes_binary_health_indicators_BRFSS2015.csv」を取り込んでみます。
import pandas as pd
# Load the dataset
file_path = '/content/drive/MyDrive/研究/糖尿病/Diabetes Health Indicators Dataset/diabetes_binary_health_indicators_BRFSS2015.csv'
data = pd.read_csv(file_path)
# Display the first few rows of the dataset
data
# Checking data types and unique values for each column
data_info = pd.DataFrame({
"Column": data.columns,
"Data Type": data.dtypes,
"Unique Values": data.nunique()
})
data_info
view raw gistfile1.txt hosted with ❤ by GitHub
(1) データの可視化
今回のデータは、カテゴリカルデータ(質的データ)と数値データ(量的データ)に分類されます。2値データ以外「'BMI', 'Age', 'GenHlth', 'MentHlth', 'PhysHlth', 'Education', 'Income'」をヒストグラムで書いてみます。
import matplotlib.pyplot as plt
import seaborn as sns
# Set the aesthetic style of the plots
sns.set_style("whitegrid")
# Selecting a subset of columns for plotting histograms
# Excluding binary columns for more meaningful histograms
hist_columns = ['BMI', 'Age', 'GenHlth', 'MentHlth', 'PhysHlth', 'Education', 'Income']
# Plotting histograms for selected columns
plt.figure(figsize=(15, 10))
for i, column in enumerate(hist_columns, 1):
plt.subplot(3, 3, i)
sns.histplot(data[column], kde=False, bins=30)
plt.title(column)
plt.tight_layout()
plt.show()
view raw gistfile1.txt hosted with ❤ by GitHub
各項目の分布を見ることができます。2値データもヒストグラムで書いてみます。
import matplotlib.pyplot as plt
import seaborn as sns
# Set the aesthetic style of the plots
sns.set_style("whitegrid")
# Selecting a subset of columns for plotting histograms
# Excluding binary columns for more meaningful histograms
hist_columns = [
"Diabetes_binary",
"HighBP",
"HighChol",
"CholCheck",
"Smoker",
"Stroke",
"HeartDiseaseorAttack",
"PhysActivity",
"Fruits",
"Veggies",
"HvyAlcoholConsump",
"AnyHealthcare",
"NoDocbcCost",
"DiffWalk",
"Sex"
]
# Plotting histograms for selected columns
plt.figure(figsize=(20, 10))
for i, column in enumerate(hist_columns, 1):
plt.subplot(3, 5, i)
sns.histplot(data[column], kde=False, bins=2)
plt.title(column)
plt.tight_layout()
plt.show()
view raw gistfile1.txt hosted with ❤ by GitHub
これらのデータに対する2項目間の基本的処理は以下になります。
・散布図(Scatter Plot): 両方の項目が数値データの場合に適しています。これにより、2つの変数間の相関関係を視覚的に把握できます。
・箱ひげ図(Box Plot): 一方がカテゴリカルデータ(例:2値データ)で、もう一方が数値データの場合に適しています。これにより、異なるカテゴリにおける数値データの分布の違いを視覚的に比較できます。
・クロス集計(Crosstab)と棒グラフ: 両方の項目がカテゴリカルデータの場合に適しています。これにより、2つのカテゴリカル変数間の関係を表形式とグラフで表示できます。

まず2値データ以外での散布図です。今回の場合は、離散化されているのであまり面白くはないです。
# Re-importing necessary libraries and reloading the data
import pandas as pd
import seaborn as sns
import matplotlib.pyplot as plt
import itertools
# Function to determine if a column is binary
def is_binary(column):
return sorted(column.unique()) == [0, 1]
# Identifying numeric columns in the dataset
numeric_columns = data.select_dtypes(include=['float64', 'int64']).columns
# Filtering out binary columns to keep only non-binary numeric columns
non_binary_numeric_columns = [col for col in numeric_columns if not is_binary(data[col])]
# Creating combinations of non-binary numeric columns for scatter plots
non_binary_combinations = list(itertools.combinations(non_binary_numeric_columns, 2))
# Setting up the plotting grid for these combinations
n_plots = len(non_binary_combinations)
n_cols = 3 # Number of columns per row
n_rows = (n_plots + n_cols - 1) // n_cols # Calculating the required number of rows
fig, axes = plt.subplots(n_rows, n_cols, figsize=(15, 5 * n_rows)) # Adjusting the figure size
axes = axes.flatten()
# Creating scatter plots for each non-binary combination
for i, (col1, col2) in enumerate(non_binary_combinations):
sns.scatterplot(x=col1, y=col2, data=data, ax=axes[i], alpha=0.5)
axes[i].set_title(f'{col1} vs {col2}')
# Hiding any unused axes
for j in range(i + 1, len(axes)):
axes[j].set_visible(False)
plt.tight_layout()
plt.show()
view raw gistfile1.txt hosted with ❤ by GitHub
次に2値データと数値データで箱ひげ図を書いてみます。
# Identifying binary columns in the dataset
binary_columns = [col for col in data.columns if is_binary(data[col])]
# Creating combinations of binary and non-binary numeric columns for box plots
binary_non_binary_combinations = list(itertools.product(binary_columns, non_binary_numeric_columns))
# Setting up the plotting grid for these combinations
n_plots = len(binary_non_binary_combinations)
n_cols = 3 # Number of columns per row
n_rows = (n_plots + n_cols - 1) // n_cols # Calculating the required number of rows
fig, axes = plt.subplots(n_rows, n_cols, figsize=(15, 5 * n_rows)) # Adjusting the figure size
axes = axes.flatten()
# Creating box plots for each combination
for i, (binary_col, numeric_col) in enumerate(binary_non_binary_combinations):
sns.boxplot(x=binary_col, y=numeric_col, data=data, ax=axes[i])
axes[i].set_title(f'{numeric_col} by {binary_col}')
# Hiding any unused axes
for j in range(i + 1, len(axes)):
axes[j].set_visible(False)
plt.tight_layout()
plt.show()
view raw gistfile1.txt hosted with ❤ by GitHub
次に2値データに対して、クロス集計をしていきます。下記は一つの例です。
# Re-importing necessary libraries and reloading the data
import pandas as pd
import seaborn as sns
import matplotlib.pyplot as plt
import itertools
# Function to determine if a column is binary
def is_binary(column):
return sorted(column.unique()) == [0, 1]
# Identifying binary columns
binary_columns = [col for col in data.columns if is_binary(data[col])]
print(binary_columns)
for i in range(1, len(binary_columns)):
binary_col1, binary_col2 = binary_columns[0], binary_columns[i]
# Creating a crosstab
ct = pd.crosstab(data[binary_col1], data[binary_col2])
# Plotting the heatmap for this specific crosstab
plt.figure(figsize=(10, 8))
sns.heatmap(ct, annot=True, fmt='d', cmap='viridis')
plt.title(f'Crosstab of {binary_col1} vs {binary_col2}')
plt.ylabel(binary_col1)
plt.xlabel(binary_col2)
plt.show()
view raw gistfile1.txt hosted with ❤ by GitHub
[演習]
ここまでの分析で何が言えるかをまとめてみましょう。
Boxplotから
PhysHlth(身体的健康) by DiffWalk(歩行困難):

平均値の違い: 約11.15
中央値の違い: 10
この組み合わせは、歩行困難がある人とない人の間で身体的健康状態に大きな違いがあることを示しています。
PhysHlth by Stroke(脳卒中):

平均値の違い: 約6.58
中央値の違い: 4
脳卒中の経験がある人とない人の間で身体的健康状態に顕著な違いが見られます。
PhysHlth by HeartDiseaseorAttack(心臓病または心臓発作):

平均値の違い: 約5.42
中央値の違い: 2
心臓病または心臓発作の経験がある人とない人の間で、身体的健康状態に大きな違いが存在します。

MentHlth(精神的健康) by NoDocbcCost(医療費用のため医者にかからない):

平均値の違い: 約5.13
中央値の違い: 2
医療費用のために医者にかからない人とそうでない人の間で、精神的健康状態に顕著な違いが見られます。
収入(Income):
糖尿病がない人の収入の中央値は糖尿病のある人よりも高い傾向にあります。これは、収入が低い人ほど糖尿病になるリスクが高い可能性を示唆しています。
糖尿病がない人の方が平均的にも中央値でも収入が高いことを示しています。平均収入において約0.98の違いがあり、中央値には1.0の違いがあります。


[演習] クロス集計から言えることをまとめてください。

2024年1月10日水曜日

生成AI時代においてプログラミングを学ぶ意味

 プログラミングはこの生成AI時代においてどのような意味を持つのでしょうか?生成AIを使えば、簡単なプログラムから難易度の高いプログラムまで、すぐに作成してくれます。僕自身、改めて考えてみました。


(1) 言語としての重要性
プログラミングで使うプログラミング言語はPythonやJavaなど色々な種類があります。「プログラミング言語」との言葉の通り、コンピュータと会話をする言語になります。人間が人間同士会話することと同じく、人間がコンピュータと会話をするためにプログラミング言語を使います。人間同士会話をするときは、単語、文法、言い回しなどを駆使して文脈を作り、話をしています。プログラミング言語でも、基本データ型、構造的プログラミングでの順次・選択・繰り返しの基本文法、関数、クラスを使って、コンピュータに実行してもらう処理を理解してもらい、実行してもらいます。人間同士話をするときも、常に同じ内容で話すのではなく、気持ちや感情にも左右され、自由度の高い会話をしています。コンピュータと会話をするとき、自分の処理したいこと、やりたいことを実行するためには、コンピュータのリソースを考え、自由度の高いプログラミングを書く必要があります。生成AIで形式的に書かれたものでは、壁にぶつかったとき、調整が効かず、乗り越えることができないかもしれません。自分自身の意思を持ったプログラミングは、その壁を乗り越えられる可能性があります。

(2) 社会人スキルとしての重要性(論理的思考)
プログラミングスキルは社会人スキルとしても重要なものとなっています。上記のようなコンピュータと柔軟な会話ができるだけでなく、プログラミングを学ぶと、どのように処理すると効果的かといった論理的思考能力が備わります。この論理的思考を抽象化・体系化したものがアルゴリズムですが、この論理的思考はビジネスなどの意思決定において、大事なものになります。

(3) 技術進歩の歴史と知の集約
プログラミングは、現代の技術進歩と共に発展してきました。アセンブラやC言語では、ハードウェアの制約の中で、いかに効率的に速く処理をするか、ソースコードから見ることができます。コンパイラでは、オートマトンを使い、字句解析、構文解析を行うことで、プログラミングをコンピュータがわかる言葉に翻訳しました。データサイエンスでよく使われるRやPythonでは、統計・機械学習のライブラリが充実しており、今まで散見していたコード上での知識の集約がされています。プログラミングを学ぶときに、このような側面を見ることで、より深くプログラミングを学ぶことができます。そして忘れてはいけないのが、このような充実したプログラミング環境が提供されているのは、現在までの技術者の方々の貢献です。ライセンスを見ても、ほとんどのものが無償で使えるものであり、オープンソースとして公開することで、さらなる技術の発展をサポートしてきました。これらの貢献に大きな謝意を忘れず、今後に引き継いでいく必要があると考えます。

生成AIが普及する中で、プログラミングを1から学ぶことの意義を忘れてしまうこともあるかと思います。上記に述べた、(1) 言語としての重要性、(2) 社会人スキルとしての重要性(論理的思考)、(3) 技術進歩の歴史と知の集約、を改めて考えてみると、プログラミングを基礎から体系的に学ぶことで、プログラミングで過去と将来、また人間とコンピュータを繋げることができ、創造的な考えから新しい技術革新を呼び起こす可能性があると思えます。この背景のもとに、プログラミングスキルを身につけることで、今後さらに普及するであろう生成AIと協働する、次の世代の技術者が誕生すると期待しています。

2024年1月8日月曜日

Chicago Divvy Bicycle Sharing Dataの分析2 : データの集計と地図表示

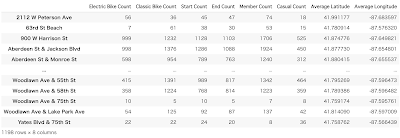
 前回やった内容(https://smizunolab.blogspot.com/2024/01/chicago-divvy-bicycle-sharing-data1.html)の基本分析に加え、主成分分析とクラスタリングを行い、データの特性を明確にしていきます。時系列のデータのままやりたいところですが、分析をしやすくするために一旦集計表を作っておきます。集計表は

(ステーション名、electric_bikeの回数、classic_bikeの回数、利用回数(start)、利用回数(end)、memberの回数、casualの回数、平均緯度、平均経度)で作成してみます。
df = divvy_tripdata
# Recalculating electric and classic bike counts as actual counts instead of rates
electric_bike_start_counts = df[df['rideable_type'] == 'electric_bike'].groupby('start_station_name')['ride_id'].count()
classic_bike_start_counts = df[df['rideable_type'] == 'classic_bike'].groupby('start_station_name')['ride_id'].count()
# Electric and classic bike counts at both start and end stations
electric_bike_end_counts = df[df['rideable_type'] == 'electric_bike'].groupby('end_station_name')['ride_id'].count()
classic_bike_end_counts = df[df['rideable_type'] == 'classic_bike'].groupby('end_station_name')['ride_id'].count()
# Combining start and end counts
electric_bike_counts = electric_bike_start_counts.add(electric_bike_end_counts, fill_value=0)
classic_bike_counts = classic_bike_start_counts.add(classic_bike_end_counts, fill_value=0)
# Recalculating member and casual counts as actual counts instead of rates
member_counts = df[df['member_casual'] == 'member'].groupby('start_station_name')['ride_id'].count()
casual_counts = df[df['member_casual'] == 'casual'].groupby('start_station_name')['ride_id'].count()
# Member and casual counts at end stations
member_end_counts = df[df['member_casual'] == 'member'].groupby('end_station_name')['ride_id'].count()
casual_end_counts = df[df['member_casual'] == 'casual'].groupby('end_station_name')['ride_id'].count()
# Combining start and end counts for members and casual users
member_counts = member_counts.add(member_end_counts, fill_value=0)
casual_counts = casual_counts.add(casual_end_counts, fill_value=0)
# Total start and end counts for each station
start_counts = df.groupby('start_station_name')['ride_id'].count()
end_counts = df.groupby('end_station_name')['ride_id'].count()
# Average latitude and longitude for each start station
average_lat = df.groupby('start_station_name')['start_lat'].mean()
average_lng = df.groupby('start_station_name')['start_lng'].mean()
# Average latitude and longitude for each end station
average_lat_end = df.groupby('end_station_name')['end_lat'].mean()
average_lng_end = df.groupby('end_station_name')['end_lng'].mean()
# Combining start and end station latitude and longitude
average_lat = average_lat.add(average_lat_end, fill_value=0) / 2
average_lng = average_lng.add(average_lng_end, fill_value=0) / 2
# Combining the recalculated counts into a single DataFrame
aggregated_data = pd.DataFrame({
'Electric Bike Count': electric_bike_counts,
'Classic Bike Count': classic_bike_counts,
'Start Count': start_counts,
'End Count': end_counts,
'Member Count': member_counts,
'Casual Count': casual_counts,
'Average Latitude': average_lat,
'Average Longitude': average_lng
})
# Filling NaN values with 0
aggregated_data = aggregated_data.fillna(0)
# 整数値に変換する列を指定
columns_to_convert = ['Electric Bike Count', 'Classic Bike Count',
'Start Count', 'End Count',
'Member Count', 'Casual Count']
# 指定された列を整数値に変換
for column in columns_to_convert:
aggregated_data[column] = aggregated_data[column].astype(int)
# Displaying the first few rows of the new aggregated data
aggregated_data
view raw gistfile1.txt hosted with ❤ by GitHub
それぞれの回数はスタート地点、エンド地点の両方でカウントしています。
(1) 散布図の描画と相関係数
まず項目間の関係を見るために、散布図を書いてみます。
import pandas as pd
import matplotlib.pyplot as plt
from itertools import combinations
# 列名のリスト
columns = ['Electric Bike Count', 'Classic Bike Count', 'Start Count', 'End Count', 'Member Count', 'Casual Count']
# 全ての組み合わせの散布図を描画する
for col1, col2 in combinations(columns, 2):
plt.figure(figsize=(8, 5))
plt.scatter(aggregated_data[col1], aggregated_data[col2], alpha=0.5)
plt.title(f'{col1} vs {col2}')
plt.xlabel(col1)
plt.ylabel(col2)
plt.grid()
plt.show()
view raw gistfile1.txt hosted with ❤ by GitHub
全部で15個のグラフが描かれます。線形になっているグラフが多いです。
次に相関係数を求めていきます。
import pandas as pd
import seaborn as sns
import matplotlib.pyplot as plt
# 列名のリスト
columns = ['Electric Bike Count', 'Classic Bike Count', 'Start Count', 'End Count', 'Member Count', 'Casual Count']
# 相関係数を計算
correlation_matrix = aggregated_data[columns].corr()
# ヒートマップの描画
plt.figure(figsize=(10, 8))
sns.heatmap(correlation_matrix, annot=True, cmap='coolwarm', fmt=".2f")
plt.title('Correlation Matrix Heatmap')
plt.show()
view raw gistfile1.txt hosted with ❤ by GitHub
これを見るとどの項目間でも相関が高い項目となっています。このまま主成分分析をやっても、主成分1に項目がまとめられてしまい、意味を成しませんが、他の項目が入ってくれば主成分分析を行うことで相関が高い項目を一つの軸としてまとめられ、多重共線性の問題を軽減することができます。多重共線性(Multicollinearity)は、統計モデリングや回帰分析において、説明変数(独立変数)同士が高い相関を持つ状況を指します。この現象が発生すると、個々の説明変数の影響を正確に推定することが難しくなり、統計モデルの解釈や信頼性に問題が生じる可能性があります。
今回は主成分分析、クラスタリングとは進まずに地図表示で各ステーションがどこにあるかを確認します。

(2) 地図表示
最初に地図表示をするためのライブラリをインストールしておきます。緯度・経度は微妙にずれているので、平均を取ったもので表示します。色々な表示方法がありますが、下記は利用回数が多いステーションを濃い色で表しています。
!pip install folium
import folium
import matplotlib.pyplot as plt
import matplotlib.colors as mcolors
# 利用回数に応じた色の設定
def get_color(usage, max_usage):
norm = plt.Normalize(aggregated_data['Total Usage'].min(), max_usage)
cmap = plt.cm.Reds #Reds
rgb = cmap(norm(usage))[:3]
return mcolors.rgb2hex(rgb)
# 最大利用回数を持つステーションの平均緯度・経度を取得
max_usage = aggregated_data['Total Usage'].max()
max_usage_lat = aggregated_data.loc[aggregated_data['Total Usage'].idxmax(), 'Average Latitude']
max_usage_lng = aggregated_data.loc[aggregated_data['Total Usage'].idxmax(), 'Average Longitude']
# 地図の初期化
m = folium.Map(location=[max_usage_lat, max_usage_lng], zoom_start=12)
# 各ステーションのマーカーを追加
for idx, row in aggregated_data.iterrows():
color = get_color(row['Total Usage'], max_usage)
folium.CircleMarker(
location=[row['Average Latitude'], row['Average Longitude']],
radius=5, # 固定サイズ
popup=f'{idx}<br>Usage: {row["Total Usage"]}',
color=color,
fill=True,
fill_color=color
).add_to(m)
# 地図を表示
m
view raw gistfile1.txt hosted with ❤ by GitHub

(3) ステーション間の推移回数と推移確率
ステーション間の推移回数を求めていきます。
# ステーション間のトリップの回数をカウント
transition_counts = df.groupby(['start_station_name', 'end_station_name']).size().reset_index(name='transition_count')
# 推移回数行列の作成
transition_matrix = transition_counts.pivot_table(index='start_station_name', columns='end_station_name', values='transition_count', fill_value=0)
# 結果を表示(上位の行のみ)
transition_matrix
view raw gistfile1.txt hosted with ❤ by GitHub
1060 rows × 1086 columns
となっており、行と列の数が違います。つまり、出発地点、または終了地点のどちらかでしか使われていないステーションがあります。出発・終了両方に含まれているステーションだけ抽出します。出発・終了地点の両方に含まれるステーションは1003拠点となりました。さらに行和が0となっているステーションがあったので、取り除くと999拠点となりました。一番右の列は行和になります。
# 行と列の両方に存在するステーション名を抽出
common_stations = set(transition_matrix.index) & set(transition_matrix.columns)
# 行と列の両方に含まれるステーションのみに行列を制限
filtered_matrix = transition_matrix.loc[common_stations, common_stations]
# filtered_matrix の各行の合計を計算
row_sums = filtered_matrix.sum(axis=1)
# 行和が0でないステーションのリストを取得
non_zero_stations = row_sums[row_sums != 0].index
# 行和が0でないステーションに対応する行と列のみを保持
filtered_matrix = filtered_matrix.loc[non_zero_stations, non_zero_stations]
# 各行の合計を新しい列として追加
filtered_matrix['Row Sum'] = row_sums
filtered_matrix.to_csv(path + 'transition_count_matrix.csv', index=True)
# 結果を表示
filtered_matrix
view raw gistfile1.txt hosted with ❤ by GitHub
999 rows × 1000 columns
これを1となる推移確率に変換していきます。
# Adjust the code to exclude the last column (row sum) in the normalization process
# We only use the numerical columns except the last one for division
numerical_part_excluding_sum = filtered_matrix.iloc[:, 1:-1] # Exclude the first (string) column and the last (row sum) column
row_sums_excluding_last_column = numerical_part_excluding_sum.sum(axis=1)
# Divide each cell by the row sum to normalize the rows, excluding the last column
normalized_matrix_excluding_sum = numerical_part_excluding_sum.div(row_sums_excluding_last_column, axis=0)
# Replace NaN values with 0
normalized_matrix_excluding_sum = normalized_matrix_excluding_sum.fillna(0)
# Re-add the station names as the first column
transition_probability_matrix = pd.concat([filtered_matrix.iloc[:, 0], normalized_matrix_excluding_sum], axis=1)
# 推移確率行列をCSVファイルに保存
transition_probability_matrix.to_csv(path + 'transition_probability_matrix.csv', index=True)
# Display the first few rows of the transition probability matrix excluding the row sum column
transition_probability_matrix
view raw gistfile1.txt hosted with ❤ by GitHub
この推移確率をヒートマップで表示していきます。
import matplotlib.pyplot as plt
import seaborn as sns
# Set the size of the heatmap
plt.figure(figsize=(20, 15))
# Adjust the heatmap color mapping to use red for high values and white for low values
plt.figure(figsize=(20, 15))
sns.heatmap(transition_probability_matrix.iloc[:, 1:], cmap='Reds')
plt.title('Transition Probability Matrix Heatmap')
plt.xlabel('Destination Station')
plt.ylabel('Start Station')
# Display the heatmap
plt.show()
view raw gistfile1.txt hosted with ❤ by GitHub
ここから定常分布を求めていきたいところですが、この推移確率はエルゴード性を持たないことが予想されますので、一度にはできません。ここでは、推移確率の算出までに留めておきます。

(3) ステーション間の平均利用時間の取得
推移確率で用いたステーションを使って、各ステーション間での平均利用時間を求めておきます。累積の利用時間、利用回数、平均利用時間を求めておきます。
import pandas as pd
df = divvy_tripdata
# 2. Convert 'started_at' and 'ended_at' to datetime
df['started_at'] = pd.to_datetime(df['started_at'])
df['ended_at'] = pd.to_datetime(df['ended_at'])
# 3. Calculate the travel time for each trip
df['travel_time'] = df['ended_at'] - df['started_at']
# 4. Convert travel time to minutes
df['travel_time_min'] = df['travel_time'].dt.total_seconds() / 60
# 5. Group by start and end station, calculate total travel time, number of trips, and mean travel time
station_stats = df.groupby(['start_station_name', 'end_station_name']).agg(
total_travel_time_min=('travel_time_min', 'sum'),
number_of_trips=('travel_time_min', 'count'),
mean_travel_time_min=('travel_time_min', 'mean')
).reset_index()
# Extracting the station names used in the transition probability matrix (second uploaded file)
used_stations = set(transition_probability_matrix.columns[1:]) # Ignoring the first column as it's also a station name
# Filter the station_stats dataframe to include only those rows where both the start and end stations are in the used_stations set
filtered_station_stats = station_stats[
(station_stats['start_station_name'].isin(used_stations)) &
(station_stats['end_station_name'].isin(used_stations))
]
filtered_station_stats
view raw gistfile1.txt hosted with ❤ by GitHub
これを推移確率と同じステーションを使って、平均利用時間行列を作成します。
# Aligning the station names exactly with the transition probability matrix, excluding any extra stations
# First, we adjust the list of station names to exclude the extra station (if any)
aligned_stations = set(transition_probability_matrix.columns) - {'start_station_name'}
# Filter the station_stats dataframe to include only those rows where both the start and end stations are in the aligned_stations set
filtered_station_stats = station_stats[
(station_stats['start_station_name'].isin(aligned_stations)) &
(station_stats['end_station_name'].isin(aligned_stations))
]
# Creating a pivot table for the mean travel times, exactly aligned with the stations in the transition probability matrix
mean_travel_time_matrix = filtered_station_stats.pivot(
index='start_station_name',
columns='end_station_name',
values='mean_travel_time_min'
)
# Filling NaN values with 0, assuming no travel time for non-existent trips
mean_travel_time_matrix = mean_travel_time_matrix.fillna(0)
# Reindexing the matrix to include only the stations from the transition probability matrix, filling missing values with 0
mean_travel_time_matrix = mean_travel_time_matrix.reindex(
index=aligned_stations,
columns=aligned_stations,
fill_value=0
)
mean_travel_time_matrix.to_csv(path + 'mean_travel_time_matrix', index=True)
mean_travel_time_matrix
view raw gistfile1.txt hosted with ❤ by GitHub

これでステーション間の移動時間を求めることができました。

2024年1月4日木曜日

Chicago Divvy Bicycle Sharing Dataの分析1 : 基本分析

 Divvy Bikesがシカゴ市で提供されている自転車共有サービスのデータを使い、基本的なデータ分析を行なっていきます。

次のリンクからデータをダウンロードします。

https://divvybikes.com/system-data

「Download Divvy trip history data」よりダウンロードページに移り、執筆時点で最新の「 202311-divvy-tripdata.zip」をダウンロードしていきます。

解凍ファイルを展開すると「202311-divvy-tripdata.csv」が得られますので、これを分析していきます。

今回もGPTから得られたコードを使ってやっていきます。

[データのインポートと基本統計量の算出と可視化]
csvを取り込んでいきます。
import pandas as pd
# Load the new CSV file
file_path_tripdata = '202311-divvy-tripdata.csv'
divvy_tripdata = pd.read_csv(file_path_tripdata)
# Display the first few rows of the dataframe to understand its structure and content
divvy_tripdata
view raw gistfile1.txt hosted with ❤ by GitHub
このファイルには、362,518行のデータがあり、それぞれ13のカラムを持ちます。
ride_id: 各ライド(乗車)に割り当てられた一意の識別子。
rideable_type: 使用された自転車のタイプ。
started_at: ライドの開始日時。
ended_at: ライドの終了日時。
start_station_name: ライド開始時のステーション名。
start_station_id: ライド開始時のステーションID。
end_station_name: ライド終了時のステーション名。
end_station_id: ライド終了時のステーションID。
start_lat: ライド開始時の緯度。
start_lng: ライド開始時の経度。
end_lat: ライド終了時の緯度。
end_lng: ライド終了時の経度。
member_casual: 利用者がメンバーかカジュアル(非メンバー)かを示す。

緯度・経度のヒストグラムを見て、中心的な場所を確認します。これらのヒストグラムは、大部分のライドが特定の範囲内の地理的な領域で発生していることを示しています。また、開始点と終了点の緯度と経度の平均値が非常に近いことから、多くのライドが同じ地域内で完了していることもわかります。
import matplotlib.pyplot as plt
# Creating separate histograms for each of the latitude and longitude columns
df = divvy_tripdata
plt.figure(figsize=(12, 8))
# Start Latitude
plt.subplot(2, 2, 1)
plt.hist(df['start_lat'], bins=30, color='skyblue', edgecolor='black')
plt.axvline(df['start_lat'].mean(), color='red', linestyle='dashed', linewidth=1)
plt.title('Start Latitude')
plt.xlabel('Start Latitude')
plt.ylabel('Frequency')
plt.grid(True)
# Start Longitude
plt.subplot(2, 2, 2)
plt.hist(df['start_lng'], bins=30, color='green', edgecolor='black')
plt.axvline(df['start_lng'].mean(), color='red', linestyle='dashed', linewidth=1)
plt.title('Start Longitude')
plt.xlabel('Start Longitude')
plt.grid(True)
# End Latitude
plt.subplot(2, 2, 3)
plt.hist(df['end_lat'].dropna(), bins=30, color='blue', edgecolor='black') # Drop NA values for end_lat
plt.axvline(df['end_lat'].mean(), color='red', linestyle='dashed', linewidth=1)
plt.title('End Latitude')
plt.xlabel('End Latitude')
plt.ylabel('Frequency')
plt.grid(True)
# End Longitude
plt.subplot(2, 2, 4)
plt.hist(df['end_lng'].dropna(), bins=30, color='purple', edgecolor='black') # Drop NA values for end_lng
plt.axvline(df['end_lng'].mean(), color='red', linestyle='dashed', linewidth=1)
plt.title('End Longitude')
plt.xlabel('End Longitude')
plt.grid(True)
plt.tight_layout()
plt.show()
view raw gistfile1.txt hosted with ❤ by GitHub
カテゴリカルデータ(「rideable_type」と「member_casual」)の出現頻度を確認します。
# Selecting categorical columns
categorical_columns = df[['rideable_type', 'member_casual']]
# Creating histograms for each categorical column
plt.figure(figsize=(12, 6))
# Rideable Type
plt.subplot(1, 2, 1)
df['rideable_type'].value_counts().plot(kind='bar', color='skyblue')
plt.title('Rideable Type Frequency')
plt.xlabel('Rideable Type')
plt.ylabel('Frequency')
plt.xticks(rotation=0)
plt.grid(axis='y')
# Member Casual
plt.subplot(1, 2, 2)
df['member_casual'].value_counts().plot(kind='bar', color='green')
plt.title('Member vs Casual Frequency')
plt.xlabel('Member Type')
plt.ylabel('Frequency')
plt.xticks(rotation=0)
plt.grid(axis='y')
plt.tight_layout()
plt.show()
view raw gistfile1.txt hosted with ❤ by GitHub
Rideable Type (自転車のタイプ): このグラフは、利用された自転車のタイプの分布を示しています。2種類の自転車タイプがあり、そのうちの一つが他よりも頻繁に利用されていることがわかります。Member vs Casual (メンバー対カジュアル): このグラフは、利用者がメンバーかカジュアル(非メンバー)かの分布を示しています。どちらか一方が他方よりも明らかに多く利用されていることが観察できます。

次に、ステーションについて確認します。件数で並び替えた際に最も多い上位20%の「start_station_name(開始ステーション名)」と「end_station_name(終了ステーション名)」のステーションを示しています。
# Adjusting to select stations that make up the top 20% of all stations by count
# Sorting the station counts
sorted_start_stations = df['start_station_name'].value_counts().sort_values(ascending=False)
sorted_end_stations = df['end_station_name'].value_counts().sort_values(ascending=False)
# Calculating the cumulative percentage
cumulative_percentage_start = sorted_start_stations.cumsum() / sorted_start_stations.sum()
cumulative_percentage_end = sorted_end_stations.cumsum() / sorted_end_stations.sum()
# Filtering for top 20%
top_20_start_stations = sorted_start_stations[cumulative_percentage_start <= 0.20]
top_20_end_stations = sorted_end_stations[cumulative_percentage_end <= 0.20]
plt.figure(figsize=(15, 10))
# Plotting for start stations
plt.subplot(2, 1, 1)
top_20_start_stations.plot(kind='bar', color='skyblue')
plt.title('Top 20% of Start Stations by Count')
plt.xlabel('Station Name')
plt.ylabel('Frequency')
plt.xticks(rotation=90)
plt.grid(axis='y')
# Plotting for end stations
plt.subplot(2, 1, 2)
top_20_end_stations.plot(kind='bar', color='green')
plt.title('Top 20% of End Stations by Count')
plt.xlabel('Station Name')
plt.ylabel('Frequency')
plt.xticks(rotation=90)
plt.grid(axis='y')
plt.tight_layout()
plt.show()
view raw gistfile1.txt hosted with ❤ by GitHub
開始、終了のステーションが同じ名前が多いことから、よく使われるステーションは開始にも終了にも使われることがわかります。
合計乗車回数で大きい方から並べたときの上位20%のステーションを示しています。各ステーションでの「開始」(スカイブルー色)と「終了」(緑色)のライド数が積み上げられています。
# Calculating total rides for each station (both start and end)
total_rides_per_station = df['start_station_name'].value_counts() + df['end_station_name'].value_counts()
# Sorting stations by total rides and selecting the top 20%
sorted_total_rides = total_rides_per_station.sort_values(ascending=False)
cumulative_percentage_total = sorted_total_rides.cumsum() / sorted_total_rides.sum()
top_20_total_stations = sorted_total_rides[cumulative_percentage_total <= 0.20]
# Separating the counts for start and end stations for the top 20%
top_20_start_counts = df['start_station_name'].value_counts().loc[top_20_total_stations.index]
top_20_end_counts = df['end_station_name'].value_counts().loc[top_20_total_stations.index]
# Plotting stacked bar chart
plt.figure(figsize=(15, 10))
top_20_start_counts.plot(kind='bar', color='skyblue', label='Start Station')
top_20_end_counts.plot(kind='bar', color='green', label='End Station', bottom=top_20_start_counts)
plt.title('Top 20% Stations by Total Rides (Start and End)')
plt.xlabel('Station Name')
plt.ylabel('Total Rides')
plt.xticks(rotation=90)
plt.legend()
plt.grid(axis='y')
plt.tight_layout()
plt.show()
view raw gistfile1.txt hosted with ❤ by GitHub
合計乗車回数に基づいて大きい方から並べたときの上位ステーションにおける、電動自転車(スカイブルー色)とクラシック自転車(緑色)の利用回数を示しています。
# Calculating the total number of rides for each station and bike type combination
electric_bike_counts = df[df['rideable_type'] == 'electric_bike'].groupby('start_station_name')['ride_id'].count()
classic_bike_counts = df[df['rideable_type'] == 'classic_bike'].groupby('start_station_name')['ride_id'].count()
# Combining the counts for each station
combined_bike_counts = electric_bike_counts.add(classic_bike_counts, fill_value=0)
# Sorting stations by total rides and selecting the top stations
sorted_combined_counts = combined_bike_counts.sort_values(ascending=False)
cumulative_percentage_bikes = sorted_combined_counts.cumsum() / sorted_combined_counts.sum()
top_stations_bikes = sorted_combined_counts[cumulative_percentage_bikes <= 0.20]
# Separating the counts for electric and classic bikes for the top stations
top_electric_counts = electric_bike_counts.loc[top_stations_bikes.index].fillna(0)
top_classic_counts = classic_bike_counts.loc[top_stations_bikes.index].fillna(0)
# Plotting stacked bar chart
plt.figure(figsize=(15, 10))
top_electric_counts.plot(kind='bar', color='skyblue', label='Electric Bike')
top_classic_counts.plot(kind='bar', color='green', label='Classic Bike', bottom=top_electric_counts)
plt.title('Top Stations by Bike Type Usage (Electric and Classic)')
plt.xlabel('Station Name')
plt.ylabel('Total Rides')
plt.xticks(rotation=90)
plt.legend()
plt.grid(axis='y')
plt.tight_layout()
plt.show()
view raw gistfile1.txt hosted with ❤ by GitHub
クラシック自転車(緑色)の比重が多い拠点が多く見られます。
次は、合計乗車回数に基づいて大きい方から並べたときの上位ステーションにおける、メンバー(スカイブルー色)とカジュアル(緑色)利用者の利用回数を示しています。
# Calculating the total number of rides for each station and member type combination
member_counts = df[df['member_casual'] == 'member'].groupby('start_station_name')['ride_id'].count()
casual_counts = df[df['member_casual'] == 'casual'].groupby('start_station_name')['ride_id'].count()
# Combining the counts for each station
combined_member_counts = member_counts.add(casual_counts, fill_value=0)
# Sorting stations by total rides and selecting the top stations
sorted_combined_member_counts = combined_member_counts.sort_values(ascending=False)
cumulative_percentage_members = sorted_combined_member_counts.cumsum() / sorted_combined_member_counts.sum()
top_stations_members = sorted_combined_member_counts[cumulative_percentage_members <= 0.20]
# Separating the counts for member and casual for the top stations
top_member_counts = member_counts.loc[top_stations_members.index].fillna(0)
top_casual_counts = casual_counts.loc[top_stations_members.index].fillna(0)
# Plotting stacked bar chart
plt.figure(figsize=(15, 10))
top_member_counts.plot(kind='bar', color='skyblue', label='Member')
top_casual_counts.plot(kind='bar', color='green', label='Casual', bottom=top_member_counts)
plt.title('Top Stations by Member Type Usage (Member and Casual)')
plt.xlabel('Station Name')
plt.ylabel('Total Rides')
plt.xticks(rotation=90)
plt.legend()
plt.grid(axis='y')
plt.tight_layout()
plt.show()
view raw gistfile1.txt hosted with ❤ by GitHub

非会員の利用率が高いステーションも見られます。

基本的な可視化まで実施しました。この後は項目間の関係性を確認し、主成分分析、クラスタリングと進めていきます。またこのデータは時系列データですので、時系列データとして扱い、推移確率を求め、マルコフ連鎖を適用しようと思います。