2024年1月8日月曜日

Chicago Divvy Bicycle Sharing Dataの分析2 : データの集計と地図表示

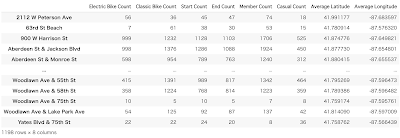
 前回やった内容(https://smizunolab.blogspot.com/2024/01/chicago-divvy-bicycle-sharing-data1.html)の基本分析に加え、主成分分析とクラスタリングを行い、データの特性を明確にしていきます。時系列のデータのままやりたいところですが、分析をしやすくするために一旦集計表を作っておきます。集計表は

(ステーション名、electric_bikeの回数、classic_bikeの回数、利用回数(start)、利用回数(end)、memberの回数、casualの回数、平均緯度、平均経度)で作成してみます。
df = divvy_tripdata
# Recalculating electric and classic bike counts as actual counts instead of rates
electric_bike_start_counts = df[df['rideable_type'] == 'electric_bike'].groupby('start_station_name')['ride_id'].count()
classic_bike_start_counts = df[df['rideable_type'] == 'classic_bike'].groupby('start_station_name')['ride_id'].count()
# Electric and classic bike counts at both start and end stations
electric_bike_end_counts = df[df['rideable_type'] == 'electric_bike'].groupby('end_station_name')['ride_id'].count()
classic_bike_end_counts = df[df['rideable_type'] == 'classic_bike'].groupby('end_station_name')['ride_id'].count()
# Combining start and end counts
electric_bike_counts = electric_bike_start_counts.add(electric_bike_end_counts, fill_value=0)
classic_bike_counts = classic_bike_start_counts.add(classic_bike_end_counts, fill_value=0)
# Recalculating member and casual counts as actual counts instead of rates
member_counts = df[df['member_casual'] == 'member'].groupby('start_station_name')['ride_id'].count()
casual_counts = df[df['member_casual'] == 'casual'].groupby('start_station_name')['ride_id'].count()
# Member and casual counts at end stations
member_end_counts = df[df['member_casual'] == 'member'].groupby('end_station_name')['ride_id'].count()
casual_end_counts = df[df['member_casual'] == 'casual'].groupby('end_station_name')['ride_id'].count()
# Combining start and end counts for members and casual users
member_counts = member_counts.add(member_end_counts, fill_value=0)
casual_counts = casual_counts.add(casual_end_counts, fill_value=0)
# Total start and end counts for each station
start_counts = df.groupby('start_station_name')['ride_id'].count()
end_counts = df.groupby('end_station_name')['ride_id'].count()
# Average latitude and longitude for each start station
average_lat = df.groupby('start_station_name')['start_lat'].mean()
average_lng = df.groupby('start_station_name')['start_lng'].mean()
# Average latitude and longitude for each end station
average_lat_end = df.groupby('end_station_name')['end_lat'].mean()
average_lng_end = df.groupby('end_station_name')['end_lng'].mean()
# Combining start and end station latitude and longitude
average_lat = average_lat.add(average_lat_end, fill_value=0) / 2
average_lng = average_lng.add(average_lng_end, fill_value=0) / 2
# Combining the recalculated counts into a single DataFrame
aggregated_data = pd.DataFrame({
'Electric Bike Count': electric_bike_counts,
'Classic Bike Count': classic_bike_counts,
'Start Count': start_counts,
'End Count': end_counts,
'Member Count': member_counts,
'Casual Count': casual_counts,
'Average Latitude': average_lat,
'Average Longitude': average_lng
})
# Filling NaN values with 0
aggregated_data = aggregated_data.fillna(0)
# 整数値に変換する列を指定
columns_to_convert = ['Electric Bike Count', 'Classic Bike Count',
'Start Count', 'End Count',
'Member Count', 'Casual Count']
# 指定された列を整数値に変換
for column in columns_to_convert:
aggregated_data[column] = aggregated_data[column].astype(int)
# Displaying the first few rows of the new aggregated data
aggregated_data
view raw gistfile1.txt hosted with ❤ by GitHub
それぞれの回数はスタート地点、エンド地点の両方でカウントしています。
(1) 散布図の描画と相関係数
まず項目間の関係を見るために、散布図を書いてみます。
import pandas as pd
import matplotlib.pyplot as plt
from itertools import combinations
# 列名のリスト
columns = ['Electric Bike Count', 'Classic Bike Count', 'Start Count', 'End Count', 'Member Count', 'Casual Count']
# 全ての組み合わせの散布図を描画する
for col1, col2 in combinations(columns, 2):
plt.figure(figsize=(8, 5))
plt.scatter(aggregated_data[col1], aggregated_data[col2], alpha=0.5)
plt.title(f'{col1} vs {col2}')
plt.xlabel(col1)
plt.ylabel(col2)
plt.grid()
plt.show()
view raw gistfile1.txt hosted with ❤ by GitHub
全部で15個のグラフが描かれます。線形になっているグラフが多いです。
次に相関係数を求めていきます。
import pandas as pd
import seaborn as sns
import matplotlib.pyplot as plt
# 列名のリスト
columns = ['Electric Bike Count', 'Classic Bike Count', 'Start Count', 'End Count', 'Member Count', 'Casual Count']
# 相関係数を計算
correlation_matrix = aggregated_data[columns].corr()
# ヒートマップの描画
plt.figure(figsize=(10, 8))
sns.heatmap(correlation_matrix, annot=True, cmap='coolwarm', fmt=".2f")
plt.title('Correlation Matrix Heatmap')
plt.show()
view raw gistfile1.txt hosted with ❤ by GitHub
これを見るとどの項目間でも相関が高い項目となっています。このまま主成分分析をやっても、主成分1に項目がまとめられてしまい、意味を成しませんが、他の項目が入ってくれば主成分分析を行うことで相関が高い項目を一つの軸としてまとめられ、多重共線性の問題を軽減することができます。多重共線性(Multicollinearity)は、統計モデリングや回帰分析において、説明変数(独立変数)同士が高い相関を持つ状況を指します。この現象が発生すると、個々の説明変数の影響を正確に推定することが難しくなり、統計モデルの解釈や信頼性に問題が生じる可能性があります。
今回は主成分分析、クラスタリングとは進まずに地図表示で各ステーションがどこにあるかを確認します。

(2) 地図表示
最初に地図表示をするためのライブラリをインストールしておきます。緯度・経度は微妙にずれているので、平均を取ったもので表示します。色々な表示方法がありますが、下記は利用回数が多いステーションを濃い色で表しています。
!pip install folium
import folium
import matplotlib.pyplot as plt
import matplotlib.colors as mcolors
# 利用回数に応じた色の設定
def get_color(usage, max_usage):
norm = plt.Normalize(aggregated_data['Total Usage'].min(), max_usage)
cmap = plt.cm.Reds #Reds
rgb = cmap(norm(usage))[:3]
return mcolors.rgb2hex(rgb)
# 最大利用回数を持つステーションの平均緯度・経度を取得
max_usage = aggregated_data['Total Usage'].max()
max_usage_lat = aggregated_data.loc[aggregated_data['Total Usage'].idxmax(), 'Average Latitude']
max_usage_lng = aggregated_data.loc[aggregated_data['Total Usage'].idxmax(), 'Average Longitude']
# 地図の初期化
m = folium.Map(location=[max_usage_lat, max_usage_lng], zoom_start=12)
# 各ステーションのマーカーを追加
for idx, row in aggregated_data.iterrows():
color = get_color(row['Total Usage'], max_usage)
folium.CircleMarker(
location=[row['Average Latitude'], row['Average Longitude']],
radius=5, # 固定サイズ
popup=f'{idx}<br>Usage: {row["Total Usage"]}',
color=color,
fill=True,
fill_color=color
).add_to(m)
# 地図を表示
m
view raw gistfile1.txt hosted with ❤ by GitHub

(3) ステーション間の推移回数と推移確率
ステーション間の推移回数を求めていきます。
# ステーション間のトリップの回数をカウント
transition_counts = df.groupby(['start_station_name', 'end_station_name']).size().reset_index(name='transition_count')
# 推移回数行列の作成
transition_matrix = transition_counts.pivot_table(index='start_station_name', columns='end_station_name', values='transition_count', fill_value=0)
# 結果を表示(上位の行のみ)
transition_matrix
view raw gistfile1.txt hosted with ❤ by GitHub
1060 rows × 1086 columns
となっており、行と列の数が違います。つまり、出発地点、または終了地点のどちらかでしか使われていないステーションがあります。出発・終了両方に含まれているステーションだけ抽出します。出発・終了地点の両方に含まれるステーションは1003拠点となりました。さらに行和が0となっているステーションがあったので、取り除くと999拠点となりました。一番右の列は行和になります。
# 行と列の両方に存在するステーション名を抽出
common_stations = set(transition_matrix.index) & set(transition_matrix.columns)
# 行と列の両方に含まれるステーションのみに行列を制限
filtered_matrix = transition_matrix.loc[common_stations, common_stations]
# filtered_matrix の各行の合計を計算
row_sums = filtered_matrix.sum(axis=1)
# 行和が0でないステーションのリストを取得
non_zero_stations = row_sums[row_sums != 0].index
# 行和が0でないステーションに対応する行と列のみを保持
filtered_matrix = filtered_matrix.loc[non_zero_stations, non_zero_stations]
# 各行の合計を新しい列として追加
filtered_matrix['Row Sum'] = row_sums
filtered_matrix.to_csv(path + 'transition_count_matrix.csv', index=True)
# 結果を表示
filtered_matrix
view raw gistfile1.txt hosted with ❤ by GitHub
999 rows × 1000 columns
これを1となる推移確率に変換していきます。
# Adjust the code to exclude the last column (row sum) in the normalization process
# We only use the numerical columns except the last one for division
numerical_part_excluding_sum = filtered_matrix.iloc[:, 1:-1] # Exclude the first (string) column and the last (row sum) column
row_sums_excluding_last_column = numerical_part_excluding_sum.sum(axis=1)
# Divide each cell by the row sum to normalize the rows, excluding the last column
normalized_matrix_excluding_sum = numerical_part_excluding_sum.div(row_sums_excluding_last_column, axis=0)
# Replace NaN values with 0
normalized_matrix_excluding_sum = normalized_matrix_excluding_sum.fillna(0)
# Re-add the station names as the first column
transition_probability_matrix = pd.concat([filtered_matrix.iloc[:, 0], normalized_matrix_excluding_sum], axis=1)
# 推移確率行列をCSVファイルに保存
transition_probability_matrix.to_csv(path + 'transition_probability_matrix.csv', index=True)
# Display the first few rows of the transition probability matrix excluding the row sum column
transition_probability_matrix
view raw gistfile1.txt hosted with ❤ by GitHub
この推移確率をヒートマップで表示していきます。
import matplotlib.pyplot as plt
import seaborn as sns
# Set the size of the heatmap
plt.figure(figsize=(20, 15))
# Adjust the heatmap color mapping to use red for high values and white for low values
plt.figure(figsize=(20, 15))
sns.heatmap(transition_probability_matrix.iloc[:, 1:], cmap='Reds')
plt.title('Transition Probability Matrix Heatmap')
plt.xlabel('Destination Station')
plt.ylabel('Start Station')
# Display the heatmap
plt.show()
view raw gistfile1.txt hosted with ❤ by GitHub
ここから定常分布を求めていきたいところですが、この推移確率はエルゴード性を持たないことが予想されますので、一度にはできません。ここでは、推移確率の算出までに留めておきます。

(3) ステーション間の平均利用時間の取得
推移確率で用いたステーションを使って、各ステーション間での平均利用時間を求めておきます。累積の利用時間、利用回数、平均利用時間を求めておきます。
import pandas as pd
df = divvy_tripdata
# 2. Convert 'started_at' and 'ended_at' to datetime
df['started_at'] = pd.to_datetime(df['started_at'])
df['ended_at'] = pd.to_datetime(df['ended_at'])
# 3. Calculate the travel time for each trip
df['travel_time'] = df['ended_at'] - df['started_at']
# 4. Convert travel time to minutes
df['travel_time_min'] = df['travel_time'].dt.total_seconds() / 60
# 5. Group by start and end station, calculate total travel time, number of trips, and mean travel time
station_stats = df.groupby(['start_station_name', 'end_station_name']).agg(
total_travel_time_min=('travel_time_min', 'sum'),
number_of_trips=('travel_time_min', 'count'),
mean_travel_time_min=('travel_time_min', 'mean')
).reset_index()
# Extracting the station names used in the transition probability matrix (second uploaded file)
used_stations = set(transition_probability_matrix.columns[1:]) # Ignoring the first column as it's also a station name
# Filter the station_stats dataframe to include only those rows where both the start and end stations are in the used_stations set
filtered_station_stats = station_stats[
(station_stats['start_station_name'].isin(used_stations)) &
(station_stats['end_station_name'].isin(used_stations))
]
filtered_station_stats
view raw gistfile1.txt hosted with ❤ by GitHub
これを推移確率と同じステーションを使って、平均利用時間行列を作成します。
# Aligning the station names exactly with the transition probability matrix, excluding any extra stations
# First, we adjust the list of station names to exclude the extra station (if any)
aligned_stations = set(transition_probability_matrix.columns) - {'start_station_name'}
# Filter the station_stats dataframe to include only those rows where both the start and end stations are in the aligned_stations set
filtered_station_stats = station_stats[
(station_stats['start_station_name'].isin(aligned_stations)) &
(station_stats['end_station_name'].isin(aligned_stations))
]
# Creating a pivot table for the mean travel times, exactly aligned with the stations in the transition probability matrix
mean_travel_time_matrix = filtered_station_stats.pivot(
index='start_station_name',
columns='end_station_name',
values='mean_travel_time_min'
)
# Filling NaN values with 0, assuming no travel time for non-existent trips
mean_travel_time_matrix = mean_travel_time_matrix.fillna(0)
# Reindexing the matrix to include only the stations from the transition probability matrix, filling missing values with 0
mean_travel_time_matrix = mean_travel_time_matrix.reindex(
index=aligned_stations,
columns=aligned_stations,
fill_value=0
)
mean_travel_time_matrix.to_csv(path + 'mean_travel_time_matrix', index=True)
mean_travel_time_matrix
view raw gistfile1.txt hosted with ❤ by GitHub

これでステーション間の移動時間を求めることができました。

0 件のコメント:

コメントを投稿